ArbieArt — Voronoi Diagram - Normal Normal Red Yellow
#abstract#generative#geometric#geometrical#geometry#math#mathematics#maths#tangle#abastractart#creativecoding#geometricart#voronoi#codeart#voronoidiagram#vornoicell#generativeart Published: 2023-10-08 08:14:22 +0000 UTC; Views: 342; Favourites: 7; Downloads: 0 Redirect to originalDescription
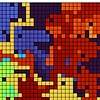
Take a set of "seed" points. What points surrounding each seed are closer to it than to any other seed? The diagram showing the boundaries of these regions is a Voronoi diagram. Each polygon in such a diagram is a Voronoi cell or Voronoi polygon. Here we start with three randomly placed seeds and draw the Voronoi diagram, then add another seed and draw the new Voronoi diagram and repeat until there are 1,000 points. The position of each point is selected from the Standard Normal distribution in two dimensions (just draw once for the x co-ordinate and again for the y co-ordinate each time). Some might know this distribution as the bell curve or the Gaussian distribution, although the Standard Normal distribution is a specific case of these. This choice of distribution leads to the higher density of central points. Reminded me of a spider's web! Don't get tangled in it...
Related content
 ArbieArt — Voronoi Diagram - Normal Normal Red Yellow


